Description
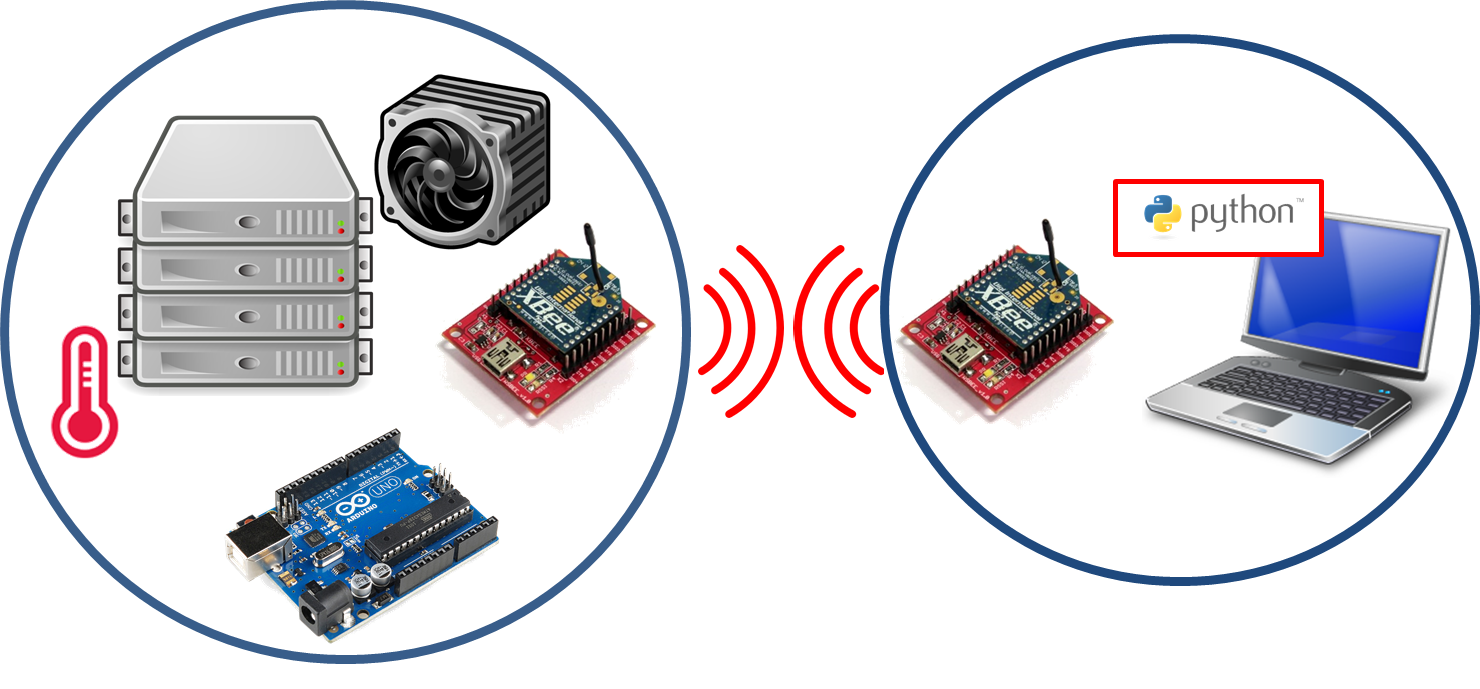
This time we are going to measure some values with sensors and send them automatically to a Visualization Platform (xively.com) through automatically generated json code.
The first part consits in a brief explanation about how to configure the system and how to send our first measurements.
Finally, we are going to extend all this with the aim to provide real evidences of how light pollution affects us and our environment (animals, plants...). As usual, we now provide a list of the material need for this practice, including HW and SW.
The materials we will need are the following:
- Hookup wires
- 2x XBee (1 configured as ZigBee Router API, 1 configured as ZigBee Coordinator API)
- 2x XBee Explorer
- 2x resistors of 22 kOhms (one is for backup)
- 2x LDR
- 1x Arduino Uno (to feed one of the XBees)
- 1x Computer
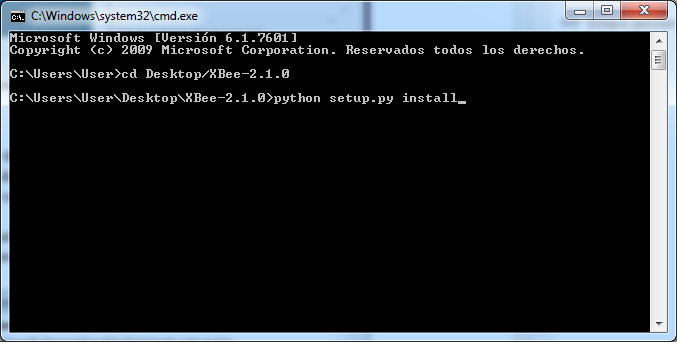
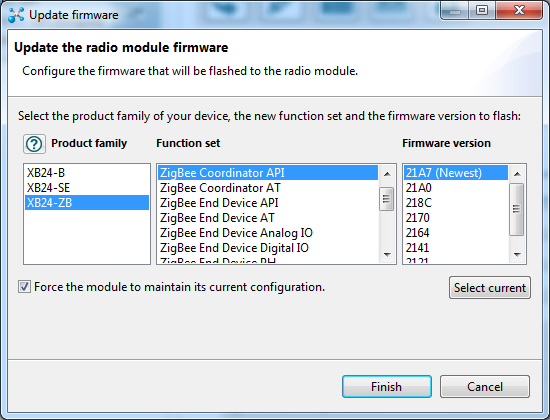
The software you will need is the following:
Part 1
As in previous lab, we have an XBee set to ZigBee Router API and the other XBee set to ZigBee Coordinator API.
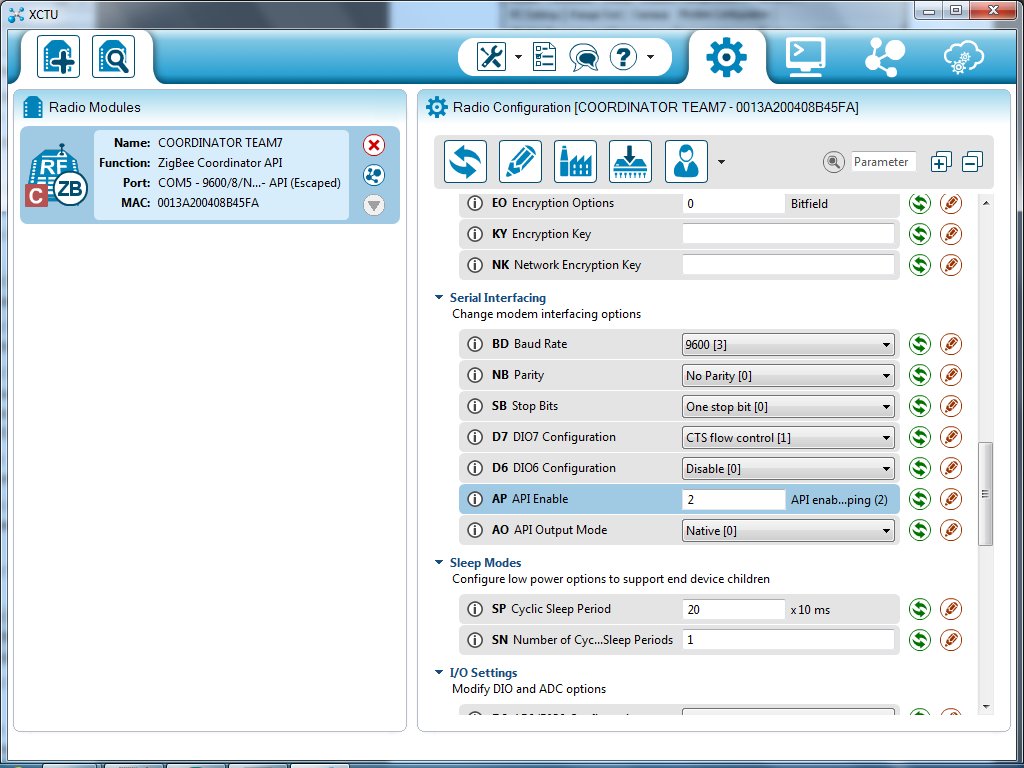
The router has to contain same PAN ID as coordinator and its address in the destination field. The field AP must be set to 2 (API enable) and we also have to configure port DO into ADC in order to receive data from the sensor.
Note that we are setting the IO Sampling Rate with 400 ms, which means that we send packets with rate 2.5 packets/second. We did that in order not to collapse Xively when we upload data.
Before sending data to Xively we must ensure that we have available "curl" command to allow communication with the Internet. If you are on windows you should download an executable and add it to your path (if you are working with cmd). You can access your computer's path variable by accessing environment variables on properties menu.
Another issue you must take into account before executing the code is to set the API endpoint with "https" or "http". It is possible that you find troubles with certifieds using "https", so we recomend you to use "http".
Now we are able to execute the code! If did not have already created an account on Xivel, you can access their webpage and create one. You will also need to add a new device and provide a description of it in order to obtain the "API Endpoint" and the "API Key", which must be included in your python code.
As the image below shows, we have uploaded our measurements into the Xively platform:
 |
| Figure 1: Measurements on Xively |
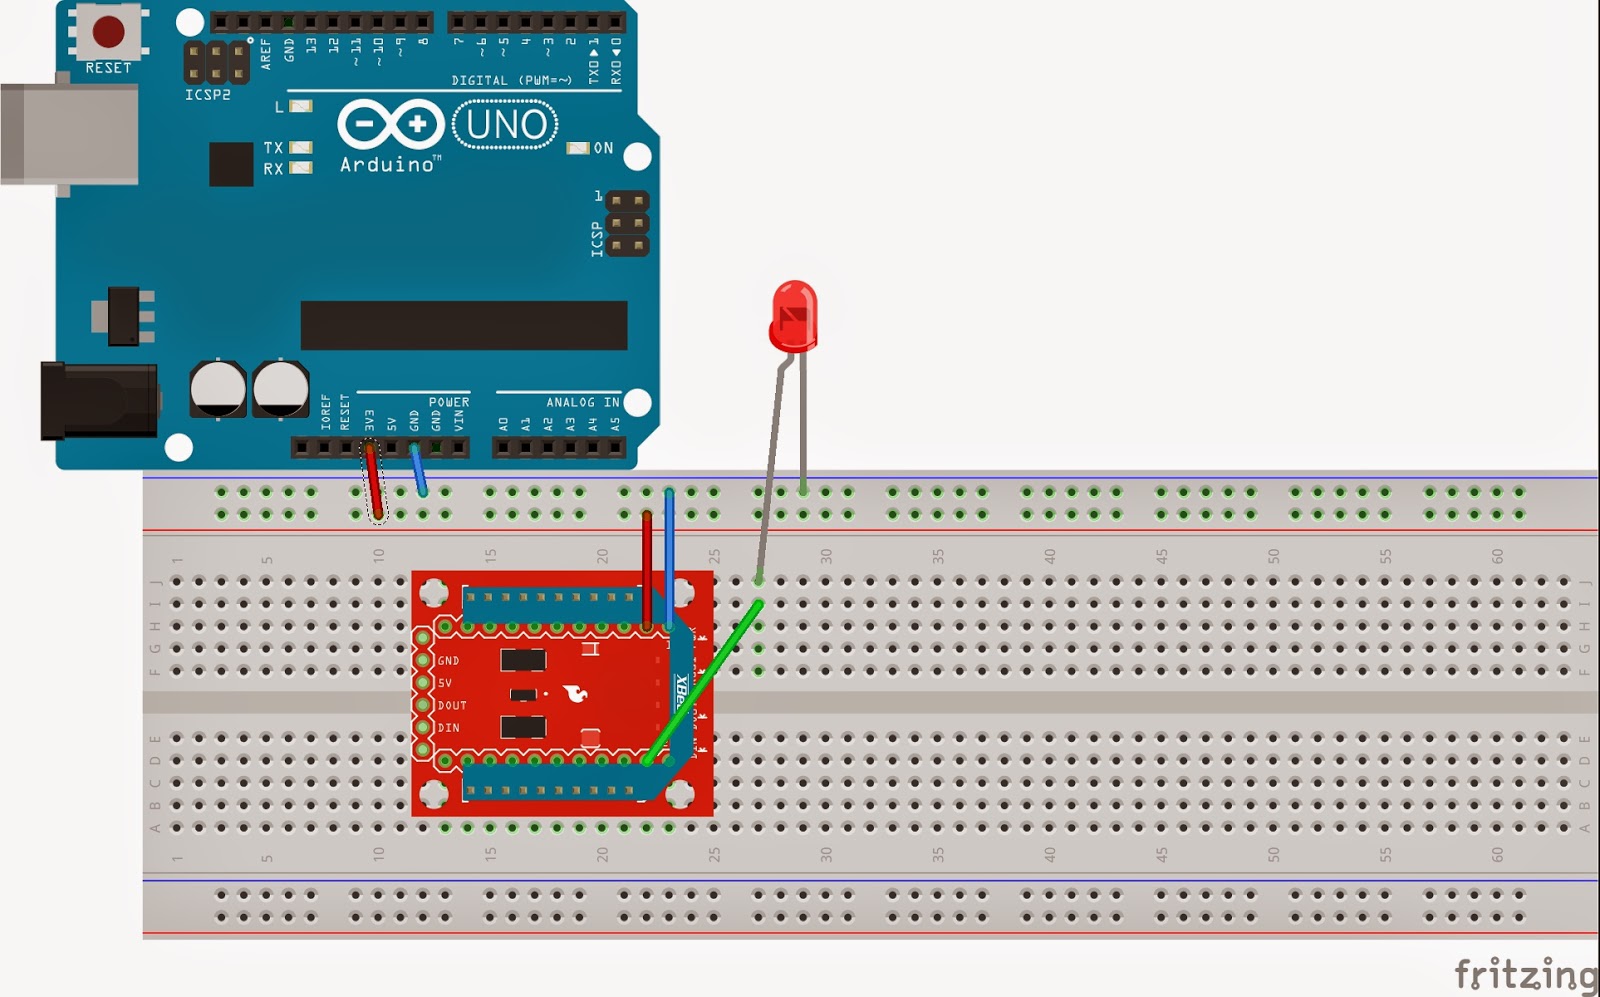
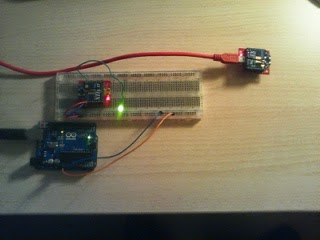
Circuit Part 1
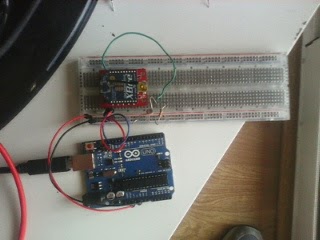 |
| Figure 2: Picture Circuit Part 1 |
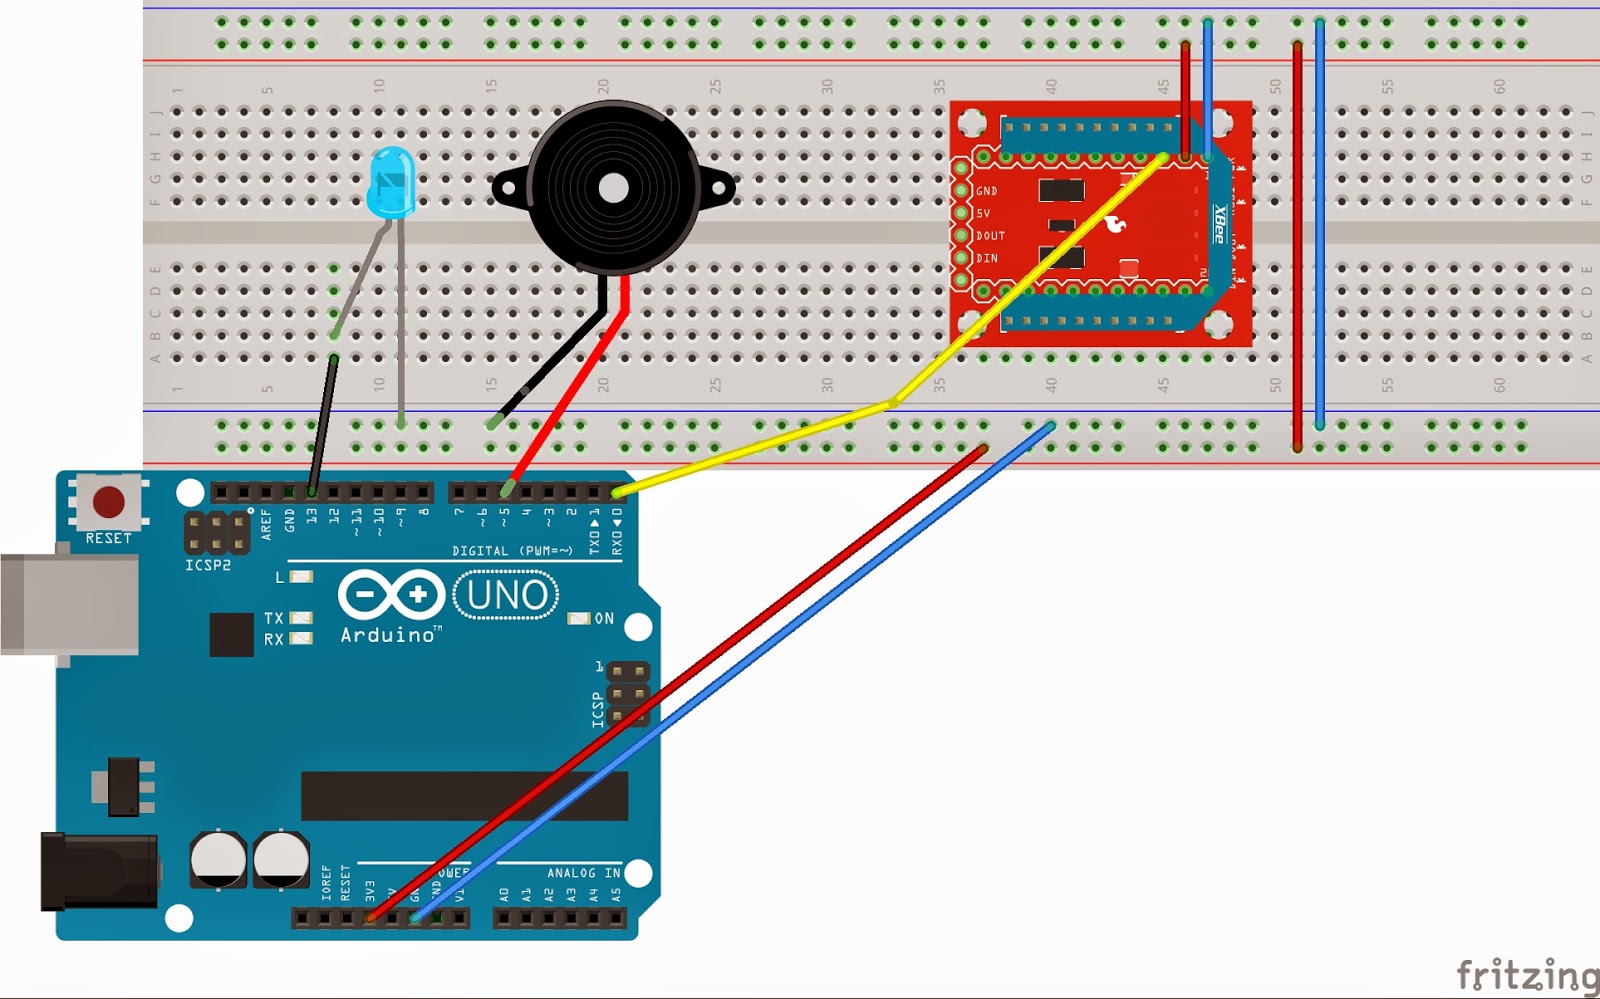
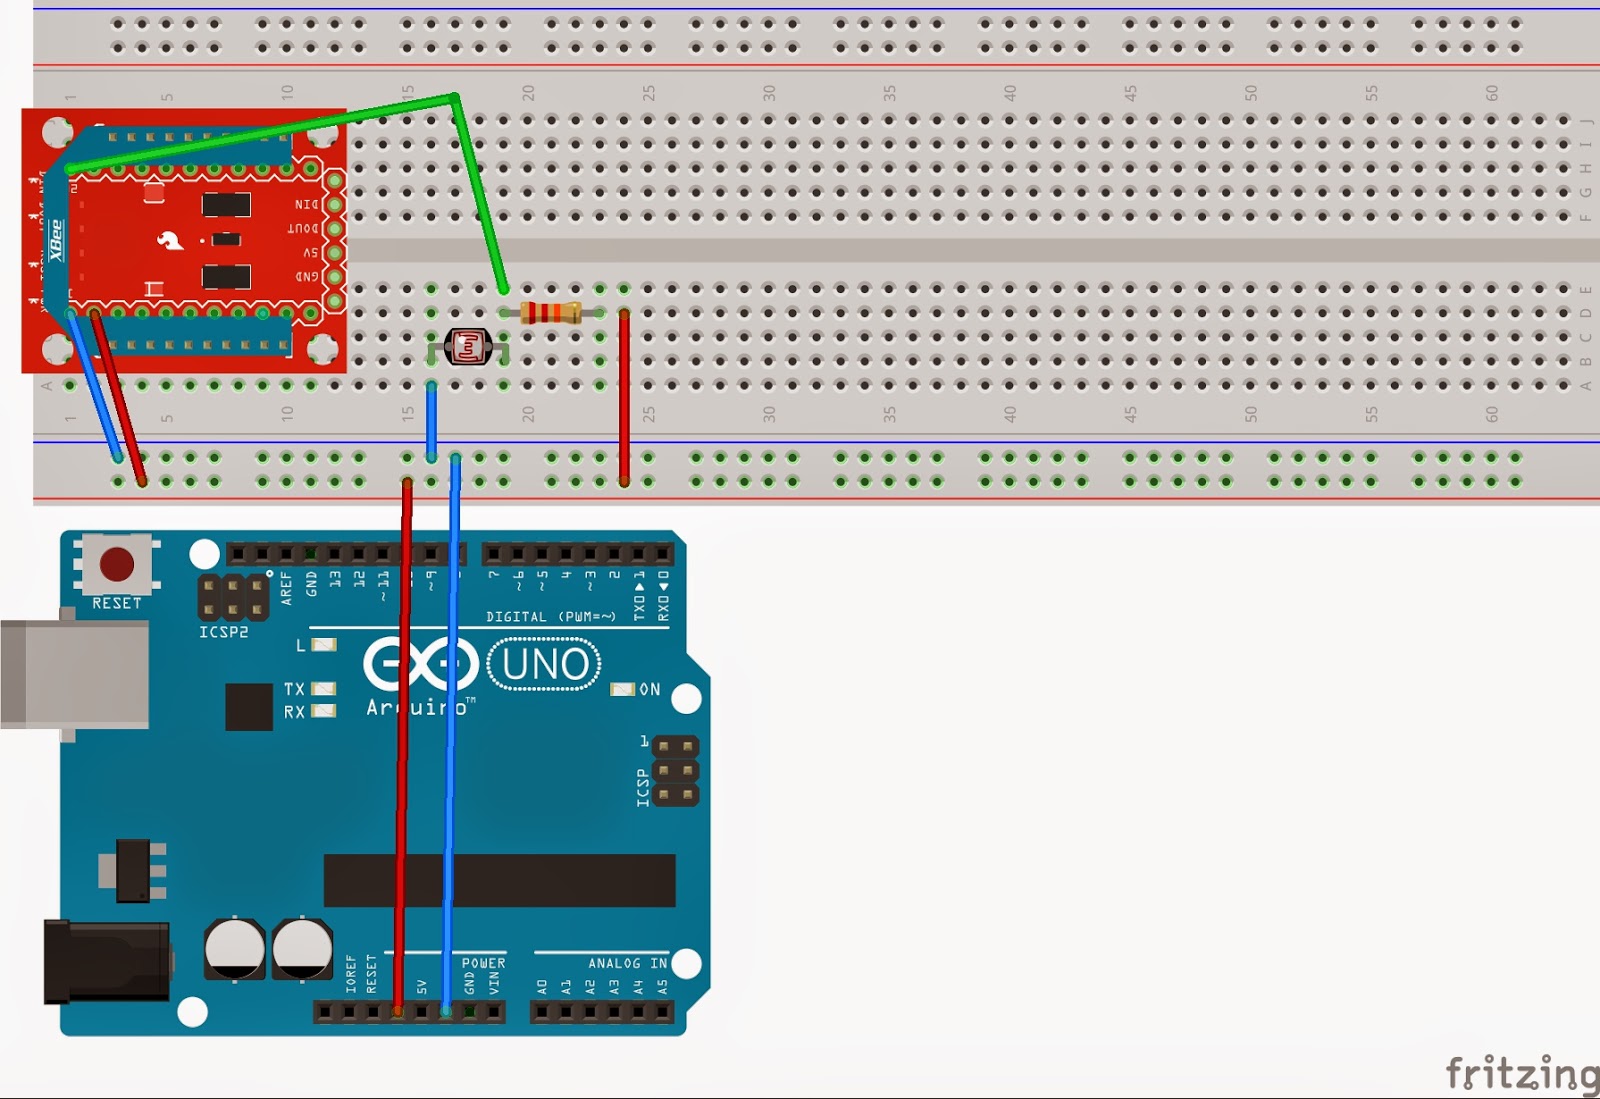 |
| Figure 3: Circuit Part 1 |
Code Part 1 [3]
The following code reads incoming values of light measurements done on the coordinator side, creates a JSON file and executes the command for uploading this file to Xively platform. A new JSON file is done and upload every time we receive data.
# Derived from code by Alejandro Andreu
import commands
import json
import serial
import time
import os
from serial import SerialException
from xbee import ZigBee

print 'Asynchronously printing data from remote XBee'

serial_port = serial.Serial('COM5', 9600)

def print_data(data):
    """
    This method is called whenever data is received.
    Its only argument is the data within the frame.
    """
    print data['samples'][0].keys()[0]

    # Create a JSON file and fill it with the received samples
    json_data = {}
    json_data['version'] = '0.2'
    json_data['datastreams'] = ()
    json_data['datastreams'] = json_data['datastreams'] + ({'id': data['samples'][0].keys()[0], 'current_value': str(data['samples'][0].values()[0])},)
    # Add more datastreams if needed
    with open('Xbee2Xively.json', mode='w') as f:
        json.dump(json_data, f, indent = 4)
    # Upload information to Xively. Use your own Api Key and feed identifier
    os.popen('curl --request PUT --data-binary @Xbee2Xively.json --header "X-ApiKey:g14aNzsNGLD0UOvi4wFXpTjzqfliK0JcfgpU0GnubyGUBzKi" --verbose https://api.xively.com/v2/feeds/779242912')

zigbee = ZigBee(serial_port, escaped = True, callback = print_data)

time.sleep(200)

zigbee.halt();
serial_port.close()
Part 2
Introduction/About
In this part we are going to experiment how light pollution affects Barcelona. About light
pollution, so far, there is little social conscience, even though it generates
numerous harmful consequences such as energy waste (and greenhouse gas
emissions resulting from their production). This also effects to human and
animals health and psychology, and, even some people could find not a priority,
it also damages astronomy activity and generates general loss of perception of
the Universe [1]. In fact, it has been shown in recent years that prolonged exposure
of the trees to artificial light can cause the trees out of control and produce
oxygen at night instead of absorbing carbon dioxide (which is one of the main
purposes of plant trees in the city). Hence, we would like to contribute a
little by making this project and divulge a bit the problematic.
As obvious,
we consider that nowadays it is a must to have well illuminated streets at
nights, but it should be a must to provide this light in an adequate, accurate
and efficient way. As an example, all
sent laterally light, upward or to paces where it is not needed, does not provide
security and visibility and is a waste of energy (environment harm) and money
(we pay lot of taxes and the contributors have the right to make our
politicians to invest where necessary).
Therefore,
we can get some experimental data and go to city hall and force them to:
- Install
streets bulbs horizontally. Use shielded lamps and luminous flux directed only
downward.
- Install
preferably sodium vapor lamps of low pressure and adequate power to use.
- Turn
off Monumental and advertising lighting after midnight (there will not be any citizen
or tourist contemplating any monument).
- Prohibit
light or laser guns, and any projector that directs light toward the sky.
- Use
asymmetrical floodlights without inclination.
- Reduce
consumption in peak hours, at dawn, by brownout on the public or the selective
off lights.
In short,
the only way to control light pollution is to reduce the amount of light sent
to heaven and reduce general consumption. We have to respect the night ecosystem.
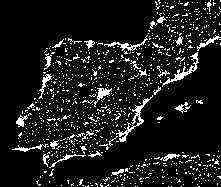 |
| Figure 4: Spanish night map [5] |
Getting experimental data
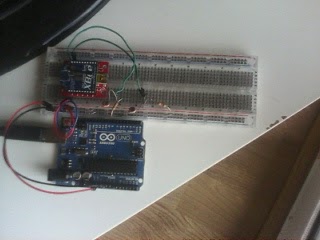
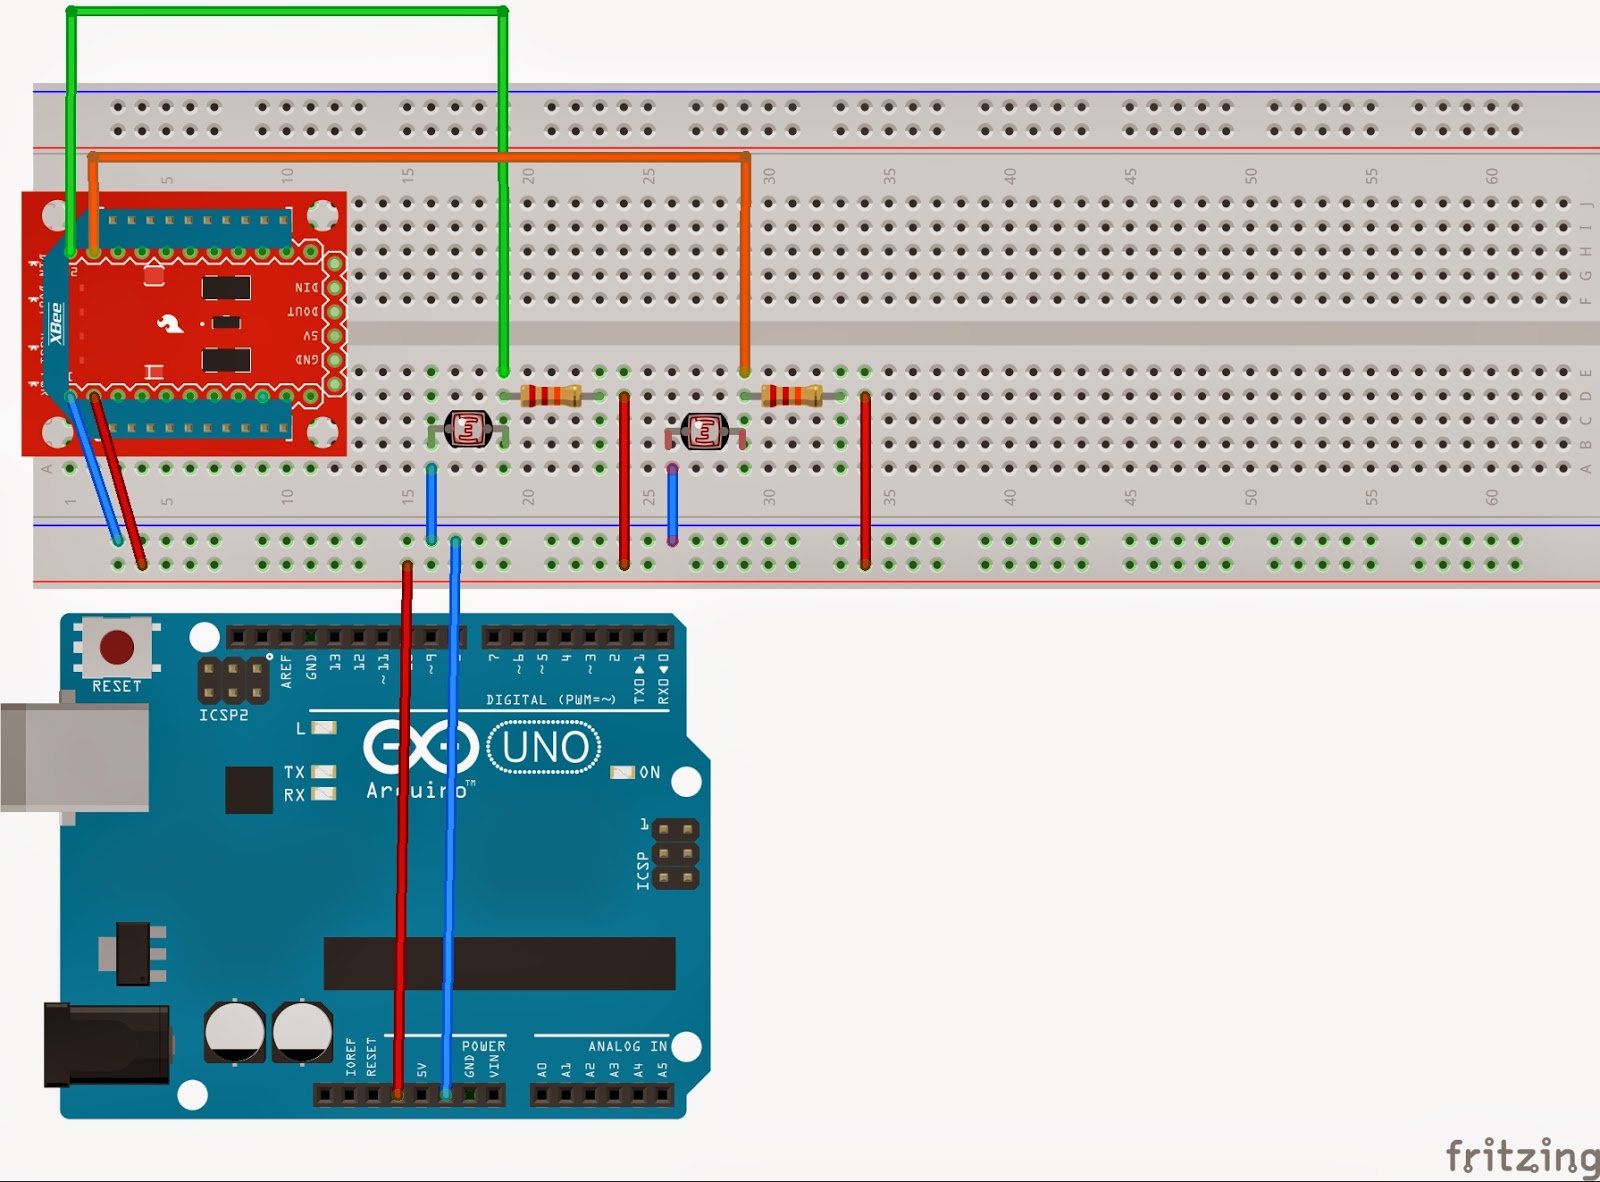
To do this, we are going to use the same procedure as before but we are also adding another sensor for backup. The information of this last sensor would be included on the same json file that we sended before in order to compare the uploaded values on the Xively platform.
The previous IO Sampling Rate was 400 ms, but now we have twice amount of data, so we set this field on 1000 ms, that means 0.5 packet per second (we have 2 sources).
As we do not have enough sensor's precision, we are just going to compare the results obtained of measuring during the day and the night with the theoretical illuminance values, which are described below:
 |
| Table 1: Illuminance values [4] |
We can see that the equivalence on day-night values must be 120000:1 in the extreme cases. In our case, we obtain measurements on a cloudy day with shadows, so our equivalence should be 500:1.
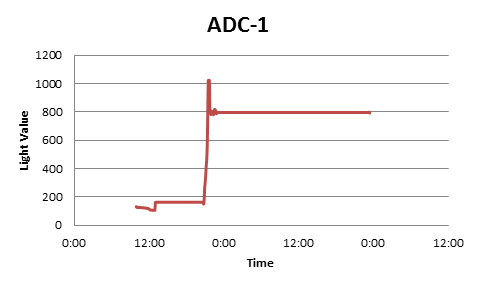
The following pictures shows the measurements done by both sensors, which are done with the data received from Xively using the following cmd command:
curl --request GET http://api.xively.com/v2/feeds/YOUR_FEED/datastreams/YOUR_CHANNEL.csv?key=YOUR_API_KEY&start=2013-12-22&duration=24hours&interval=900&limit=100&interval_type=discrete" > data.csv
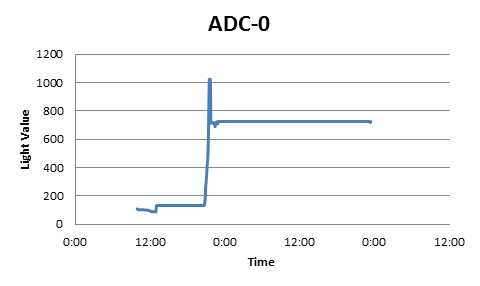 |
| Figure 5: ADC-0 measurements |
 |
| Figure 6: ADC-1 measurements |
We can observe that measured light on the night is not far enough from received during a shinny day, so we can observe an equivalence of 4:1, which is so far away of our assumptions.
Note that both graphs show the same data from 23:00 of the first day to 0.00 of the second day. This is because Xively gaves us a graphic with the last token value (at 23:30) extended until the moment we requested the data.
Circuit Part 2
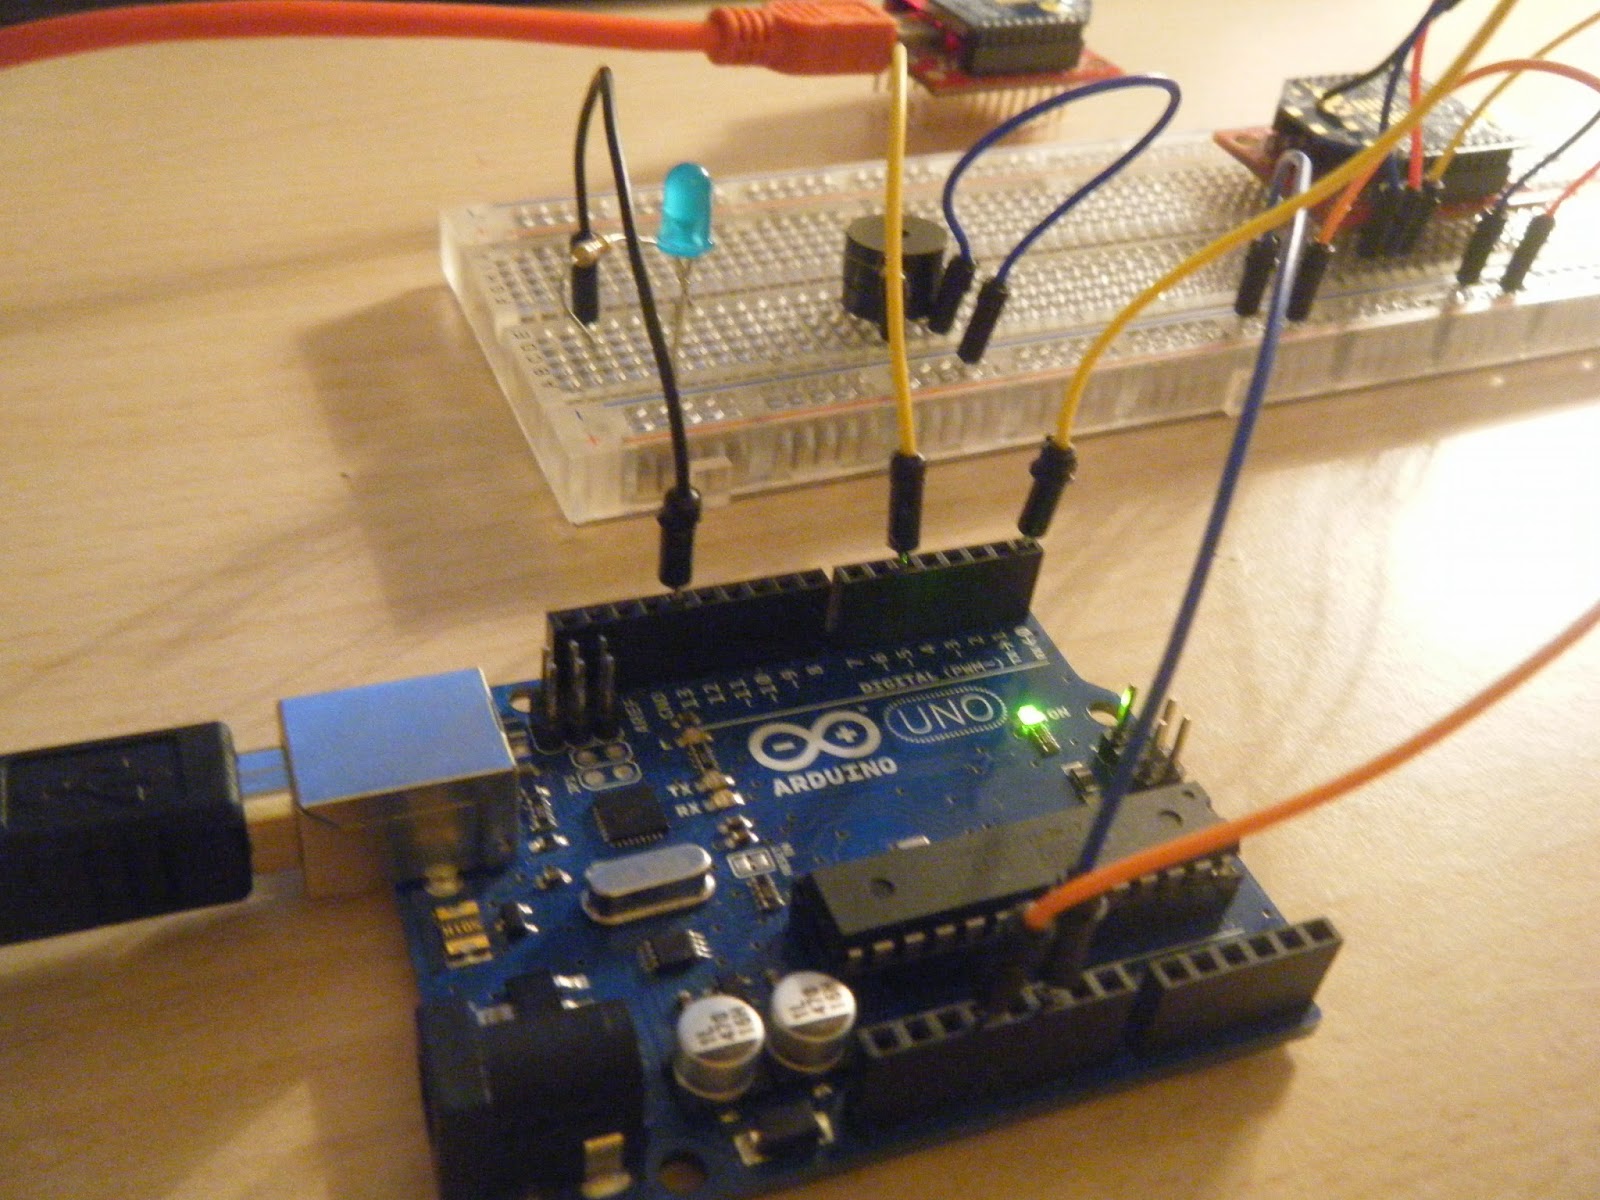
 |
| Figure 7: Picture Circuit Part 2 |
 |
| Figure 8: Circuit Part 2 |
Code Part 2 [3]
# Derived from code by Alejandro Andreu
import commands
import json
import serial
import time
import os
from serial import SerialException
from xbee import ZigBee

print 'Asynchronously printing data from remote XBee'

serial_port = serial.Serial('COM5', 9600)

def print_data(data):
    """
    This method is called whenever data is received.
    Its only argument is the data within the frame.
    """
    print data['samples'][0].keys()[0]
    print data['samples'][0].values()[0]
    print data['samples'][0].keys()[1]
    print data['samples'][0].values()[1]

    # Create a JSON file and fill it with the received samples
    json_data = {}
    json_data['version'] = '0.2'
    json_data['datastreams'] = ()
    json_data['datastreams'] = json_data['datastreams'] + ({'id': data['samples'][0].keys()[0], 'current_value': str(data['samples'][0].values()[0])},)

    with open('Xbee2Xively.json', mode='w') as f:
        json.dump(json_data, f, indent = 4)

 # Add data from adc-1 pin
    json_data1 = {}
    json_data1['version'] = '0.2'
    json_data1['datastreams'] = ()
    json_data1['datastreams'] = json_data['datastreams'] + ({'id': data['samples'][0].keys()[1], 'current_value': str(data['samples'][0].values()[1])},)

    with open('Xbee2Xively.json', mode='w') as f:
        json.dump(json_data1, f, indent = 4)


zigbee = ZigBee(serial_port, callback = print_data)
while True:
    try:
        time.sleep(500)
    except KeyboardInterrupt:
        break

zigbee.halt();
serial_port.close()
References
[1] Python software and libraries, retrieved from: https://www.python.org/
[2] XBee library for Arduino, retrieved from: https://code.google.com/p/xbee-arduino/
[3] Version of the code "upload_to_xively.py" from Jaume Barceló and Luis Sanabria
[4] Light pollution information from "Universidad de Murcia" report, retrieved from: http://www.um.es/cieloscuro/documentos/divulgacion/cluminica_dos_palabras.pdf
[5] Image from "celfosc", retrieved from:
http://www.celfosc.org/
[6] Illuminance information from Wikipedia, retrieved from:
http://en.wikipedia.org/wiki/Daylight


